RとRStudio入門
Figure 1
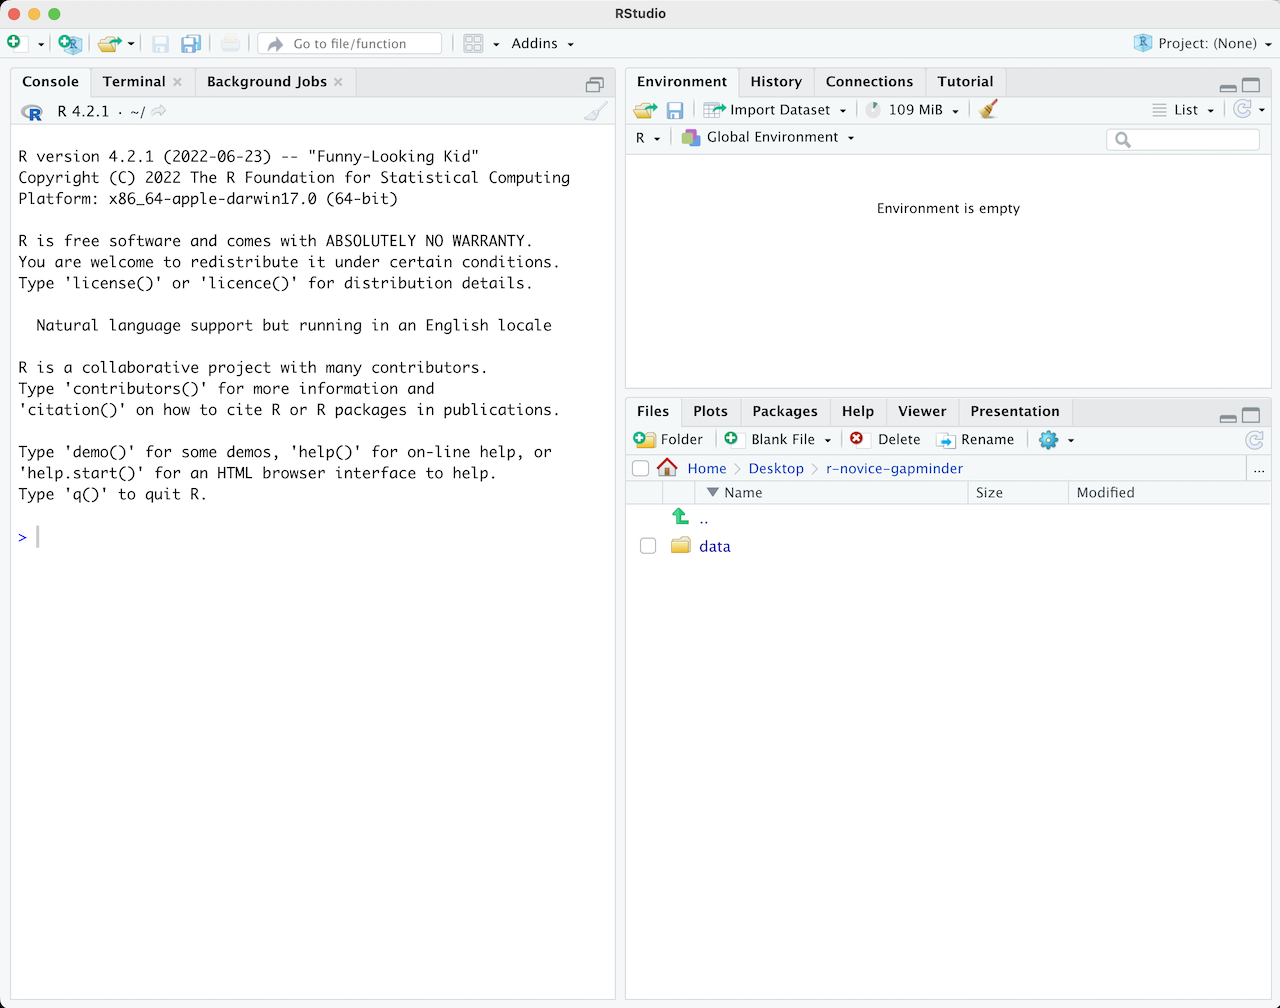
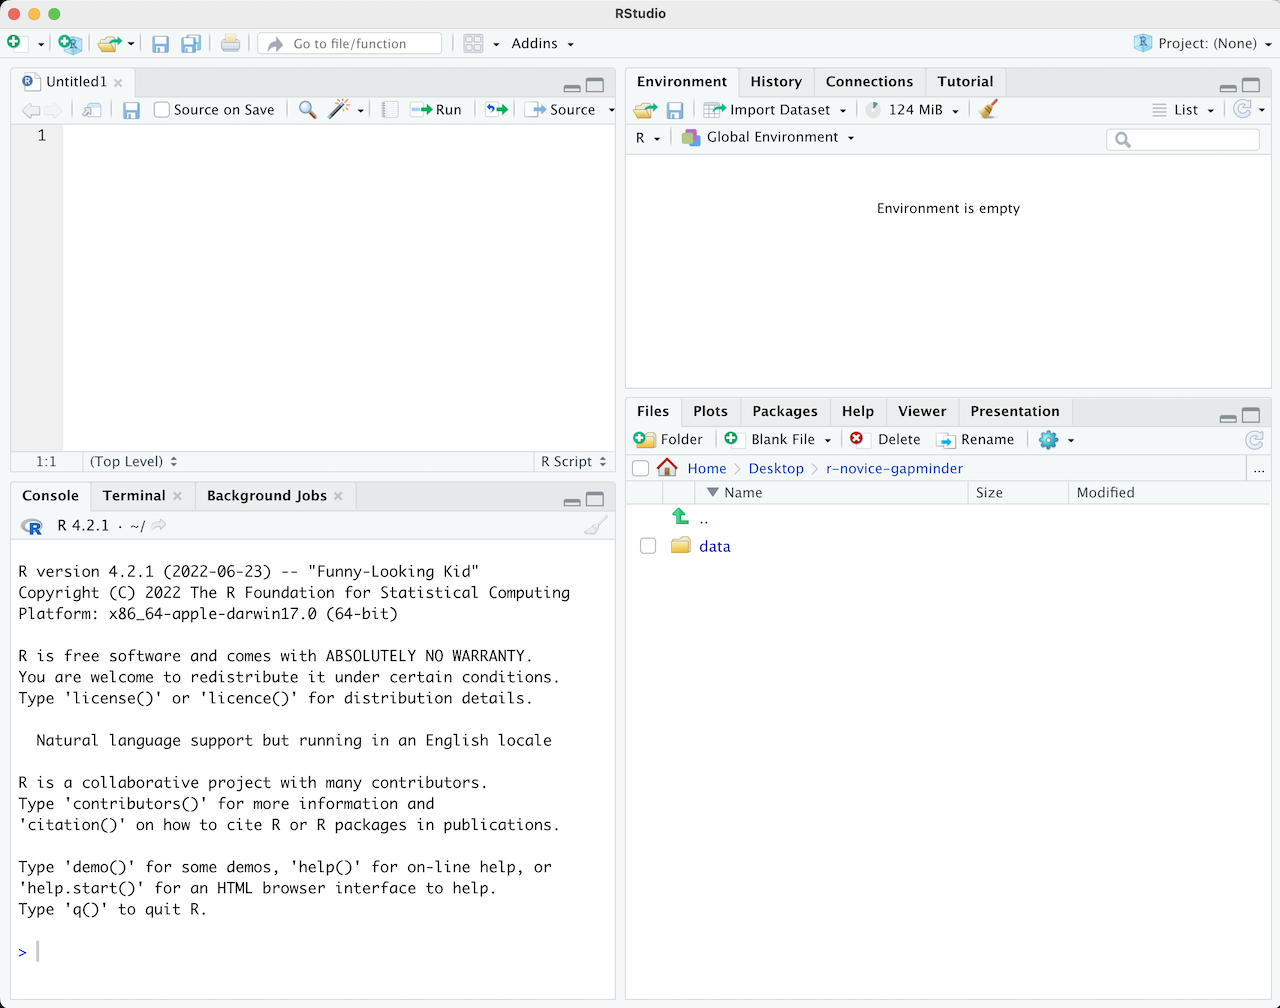
Figure 2
RStudio を使ったプロジェクト管理
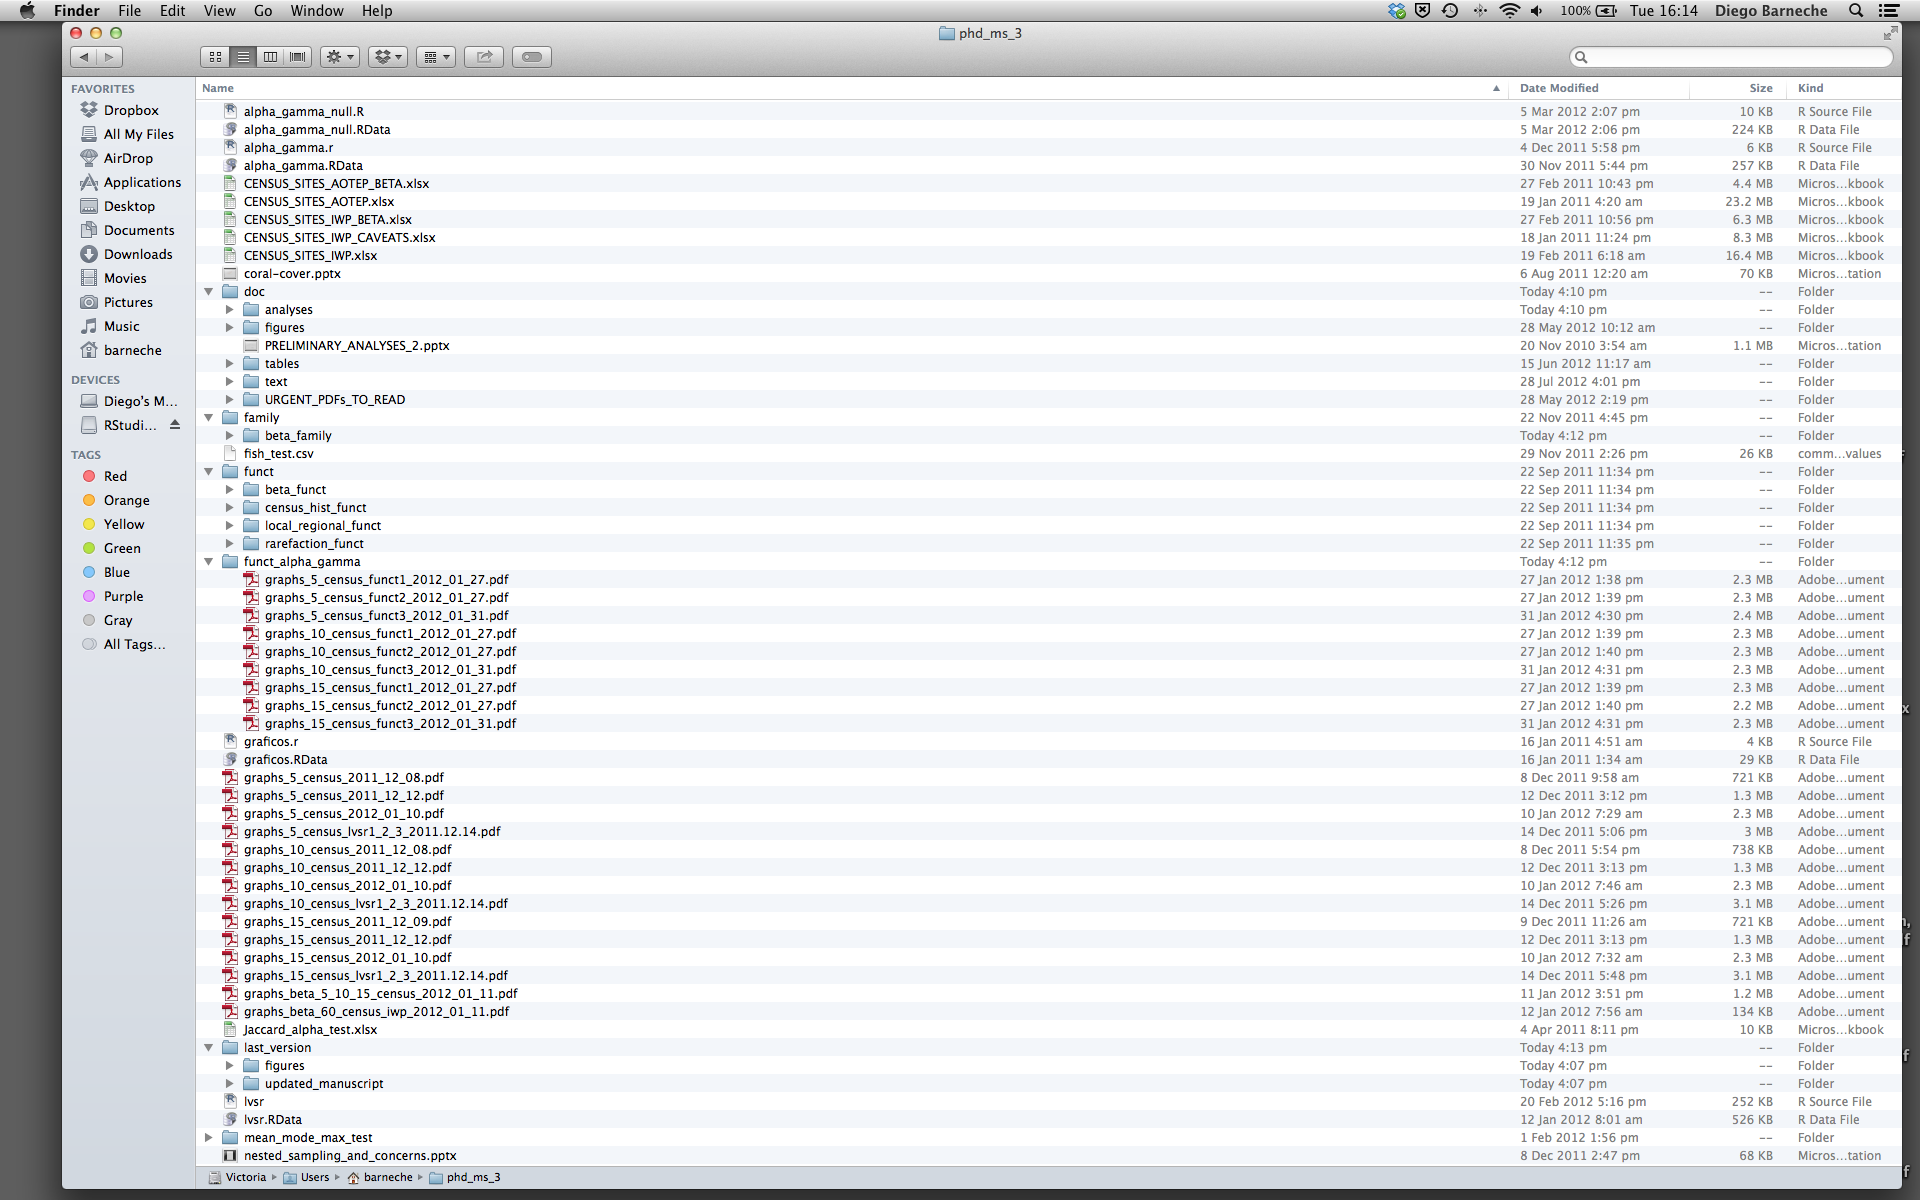
Figure 1
ヘルプの利用
データ構造
データフレームの操作
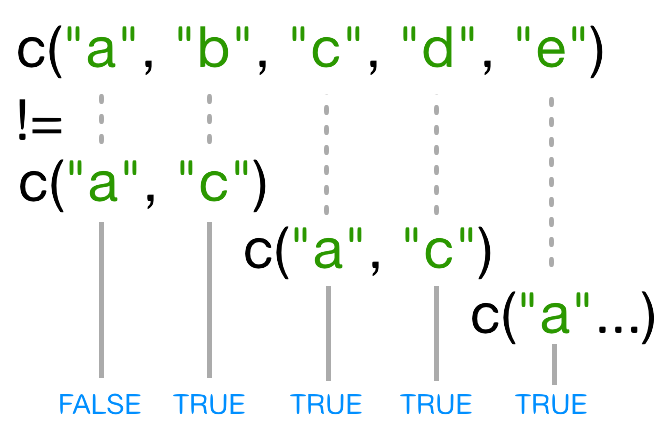
データの部分集合化
Figure 1
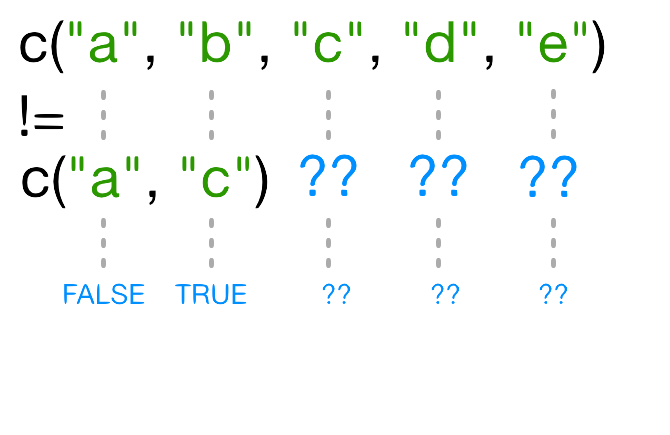
Figure 2
Control Flow
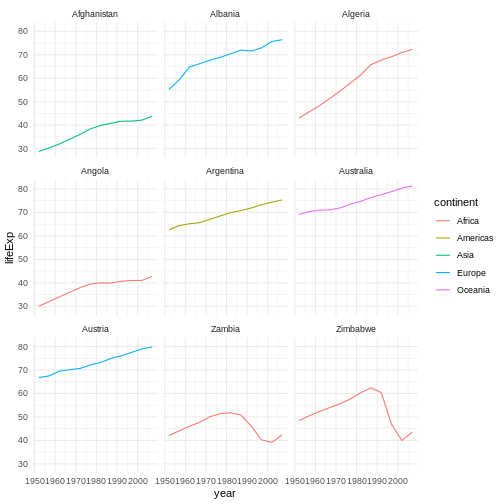
Creating Publication-Quality Graphics with ggplot2
Figure 1

Figure 2
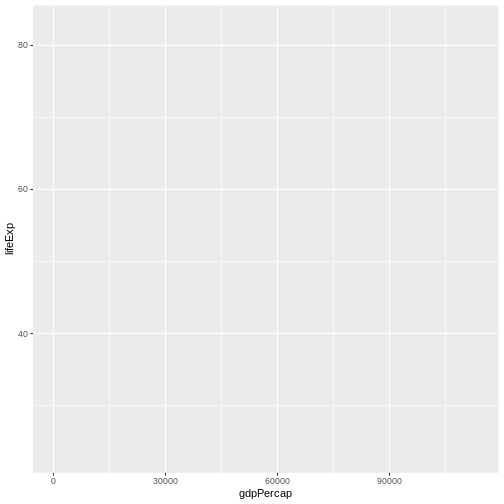
Figure 3

Figure 4
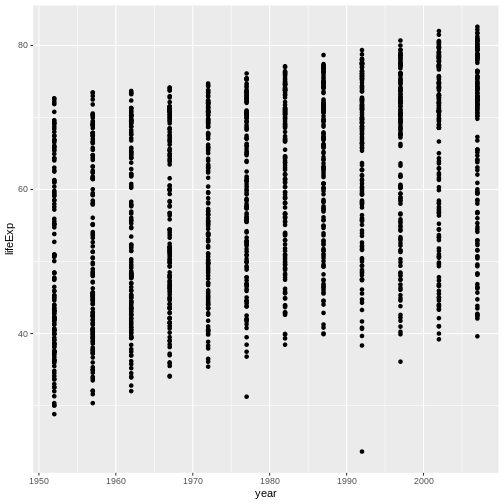
Figure 5
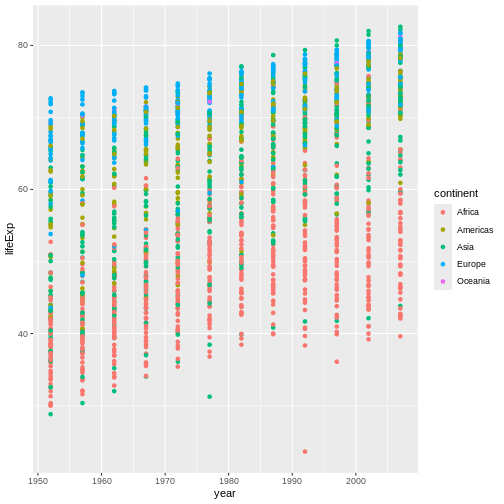
Figure 6
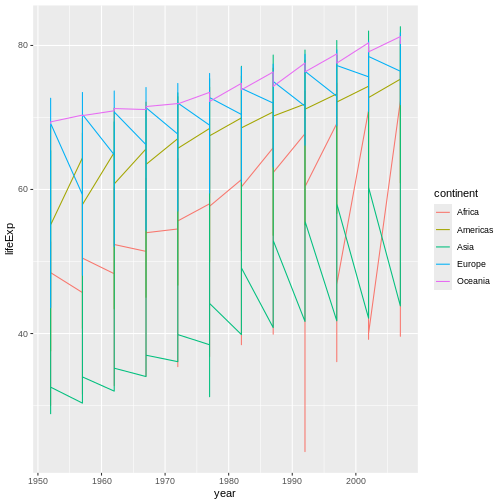
Figure 7
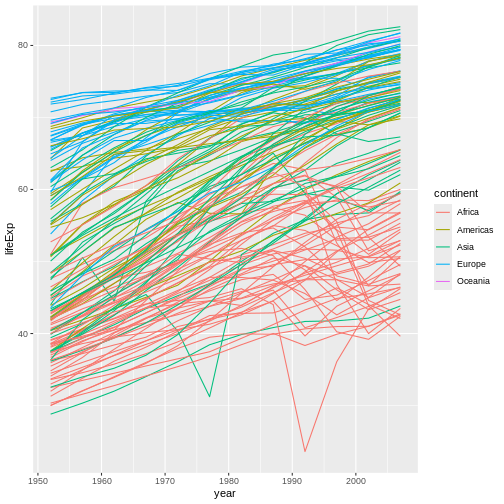
Figure 8

Figure 9
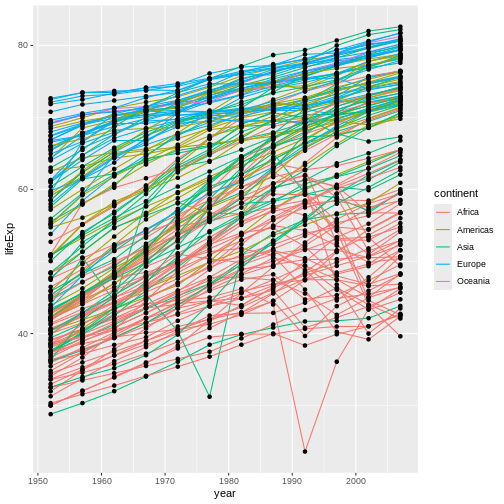
Figure 10

Figure 11
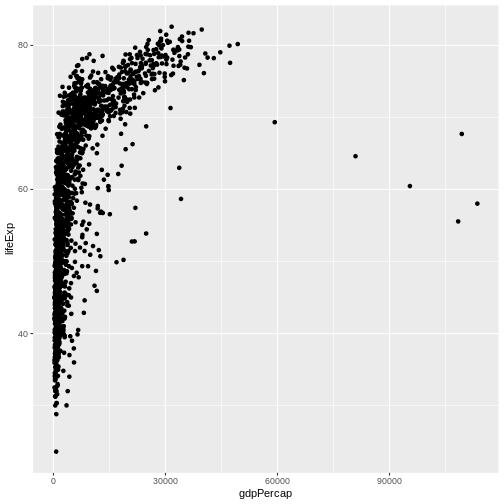
Figure 12
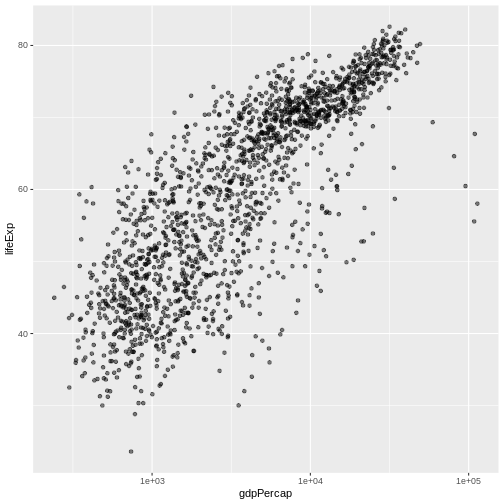
Figure 13
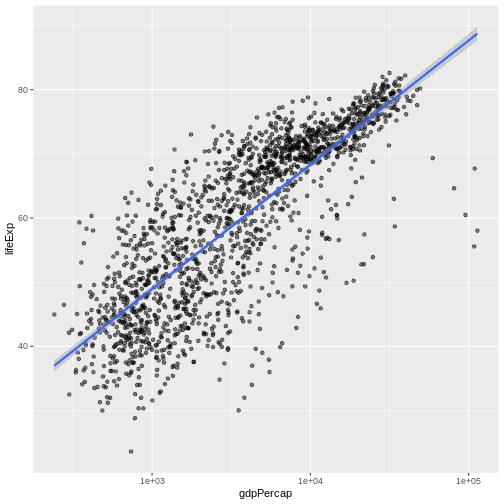
Figure 14
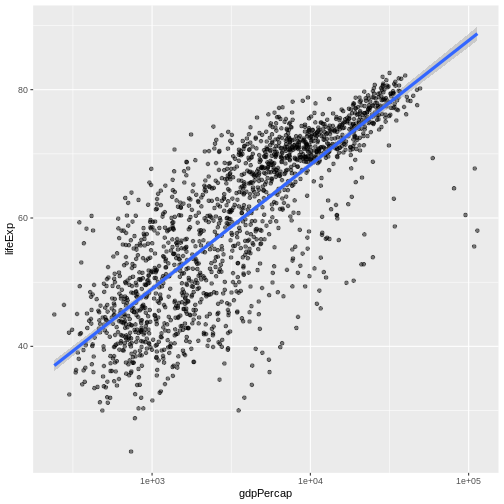
Figure 15
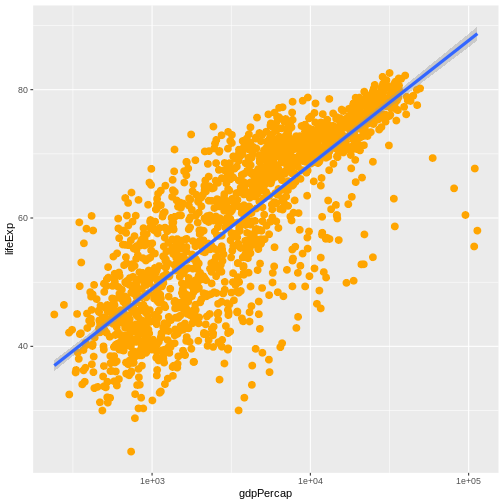
Figure 16
Figure 17

Figure 18
Figure 19
Vectorization
Figure 1
Figure 2
Functions Explained
Writing Data
Data Frame Manipulation with dplyr
Figure 1
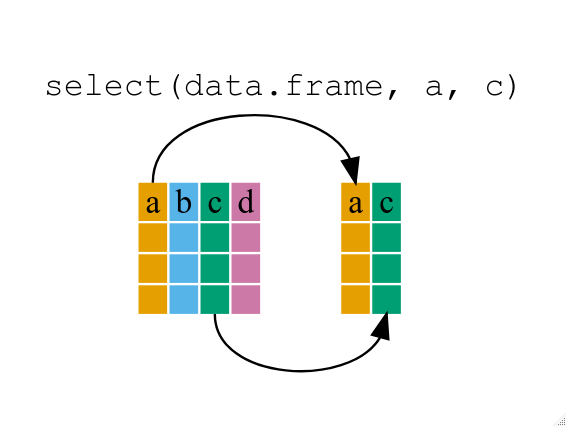 If we want to remove one column only from the
 gapminder
data, for example, removing the continent column.
Figure 2
Figure 3
Figure 4
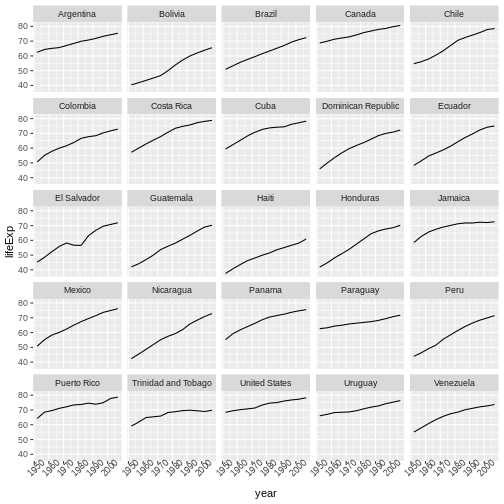
Figure 5

Figure 6
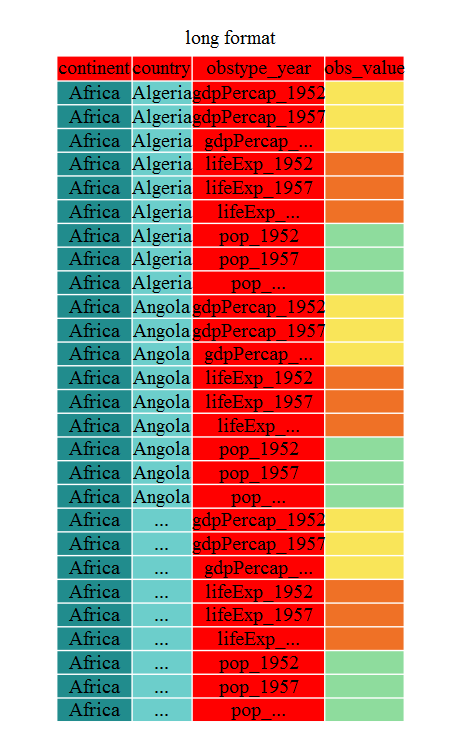
Data Frame Manipulation with tidyr
Figure 1
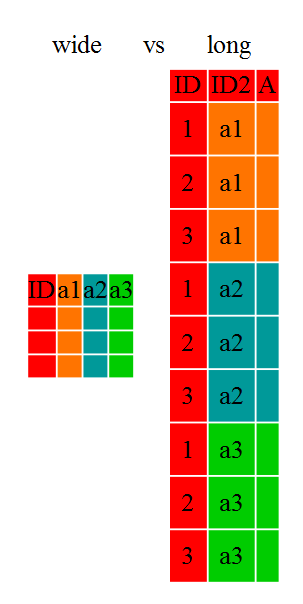
Figure 2
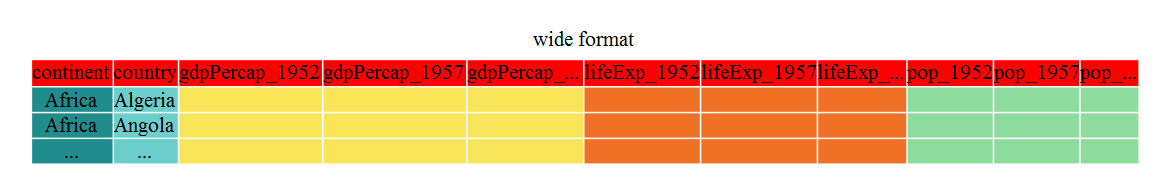
Figure 3
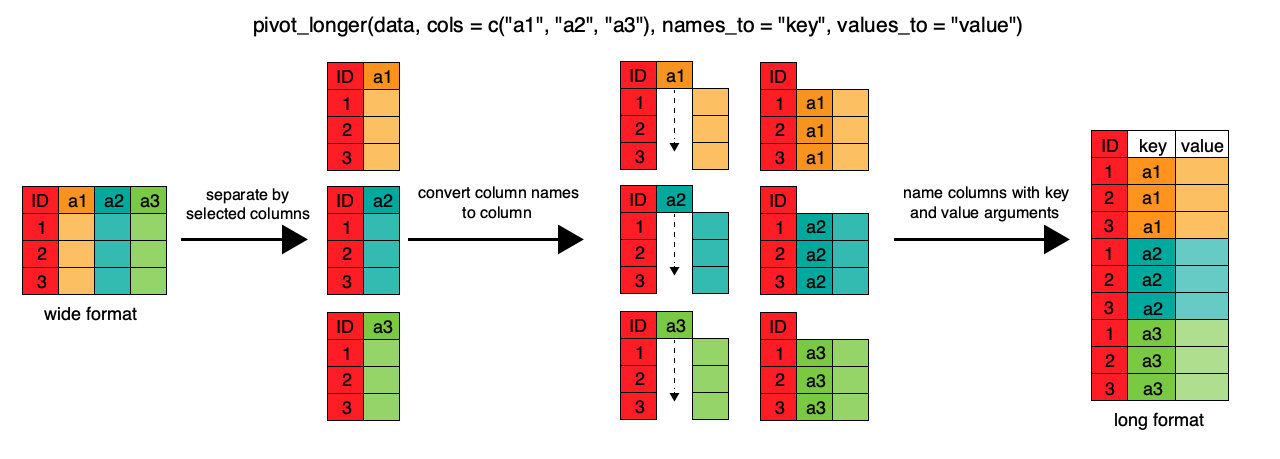
Figure 4
Producing Reports With knitr
Figure 1
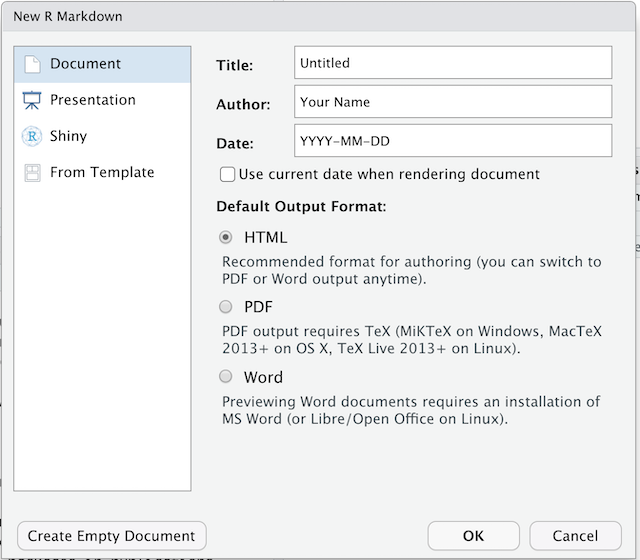
Figure 2
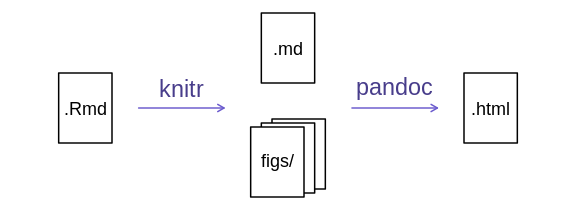
Figure 3
RStudio versions 1.4 and later include visual markdown editing mode.
In visual editing mode, markdown expressions (like
**bold words**) are transformed to the formatted appearance
(bold words) as you type. This mode also includes a
toolbar at the top with basic formatting buttons, similar to what you
might see in common word processing software programs. You can turn
visual editing on and off by pressing the ![]() button in the top right corner of your R Markdown document.
button in the top right corner of your R Markdown document.